The Workforce Ahead: Designing and Planning for…

Measuring circularity is essential to effectively managing it. A benchmark conducted by Sia among 50 European companies highlights practices that remain heterogeneous. This study proposes a method for structuring and implementing appropriate indicators.

According to the Conference Board, the circular economy has become European executives’ top environmental priority in 2026. Yet companies still struggle to measure it: a benchmark conducted by Sia among 50 large European companies found that more than 60% of indicators are used by only one company. This finding highlights a key challenge: if organisations are to accelerate their transition towards more circular business models, they need reliable, comparable indicators that can be directly integrated into their decision-making processes.
With a circularity rate of only 12.2% in Europe in 2024, according to the EEA, there is considerable room for improvement. In this context, circularity indicators are becoming essential management tools at the intersection of four key challenges:
Measuring circularity makes it possible to quantify reductions in environmental impacts and, consequently, to prioritise the most impactful actions. In particular, intensity indicators—such as tonnes of waste per million euros or cubic metres of water relative to net revenue—make the decoupling of growth from resource consumption visible.
Circularity indicators provide tangible evidence to meet growing sustainability requirements. In Europe, investment in the circular economy has risen from €70–80 billion in 2015 to €120 billion today, according to the EIB and the European Commission (2026). This trend confirms the increasing importance of transparency and traceability requirements associated with both public and private funding.
Faced with volatile raw-material costs and supply-chain pressures, companies that diversify their sources through reuse, recycled content, and resource optimisation strengthen their resilience. Tracking circular performance makes it possible to manage these savings and measure the competitive advantage gained.
Regulations now impose performance requirements that call for precise, structured reporting.
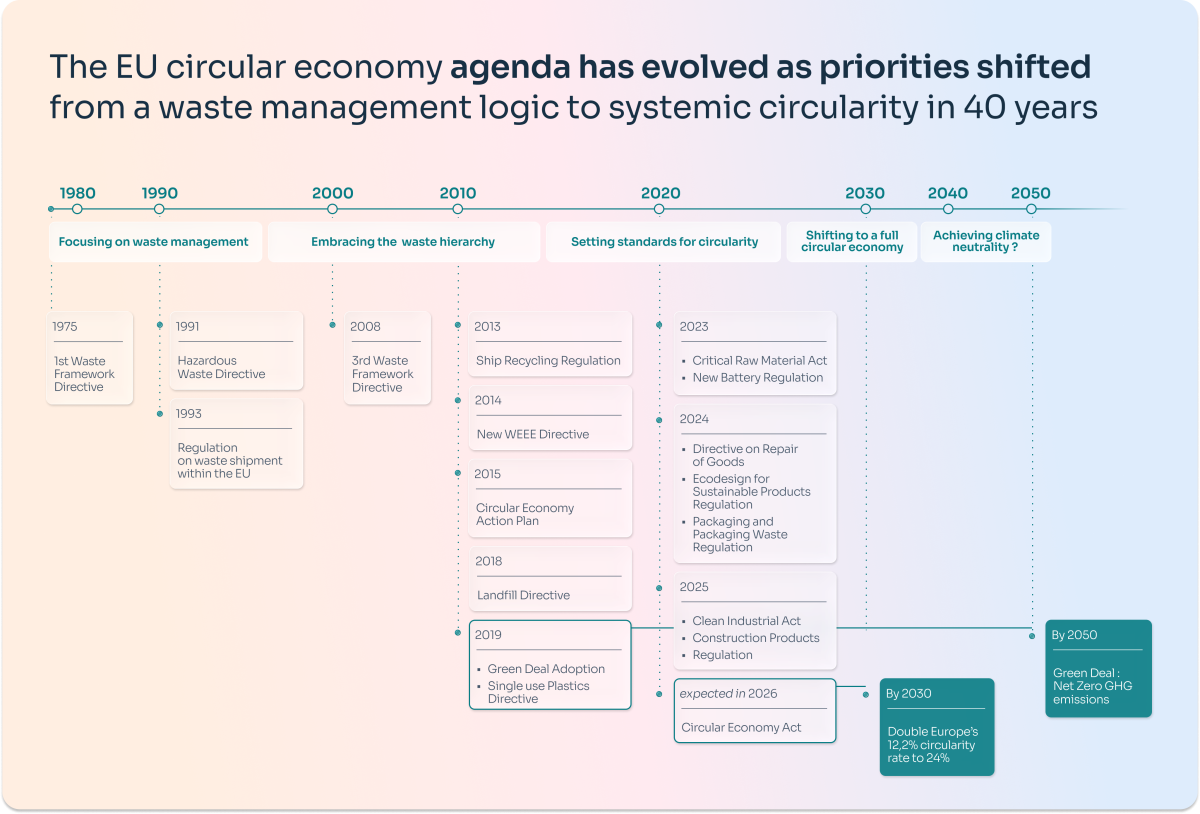
Over the past forty years, European regulatory momentum has intensified considerably, marking a shift from an incentive-based approach to an increasingly binding framework. The timeline below traces this acceleration in European Union legislation, which now shapes the single market.
To identify best practices and develop a robust assessment methodology, Sia conducted a benchmark of 50 European leaders across five material-intensive sectors: Food & Beverage, Construction, Electronics, Textiles, and Transport. This comparative analysis reveals a measurement landscape that remains fragmented.
An emerging standardisation. Among the indicators identified, 75% are still experimental and are used by three companies or fewer. The few indicators that have reached a degree of consensus remain confined to waste management, which accounts for 90% of the indicators used by more than 10 of the 50 companies analysed. This lack of a common framework undermines the comparability and credibility of circular performance disclosures.
Highly contrasting sector profiles. No single set of indicators is consistently applied across sectors: they differ in both volume and focus. Construction uses the largest number of circularity indicators—8.3 per company on average—primarily focused on downstream activities and waste-related regulatory requirements. Textiles and food & beverage place greater emphasis on upstream activities, with a strong focus on responsible sourcing and packaging reduction. Electronics stands out as the most advanced sector in monitoring product lifespan. By contrast, transport uses only 4.4 indicators per company on average, 92% of which are universal metrics—applicable across all sectors. This gap is likely to narrow as regulatory requirements for batteries come into force.
A lifecycle still measured through the lens of end-of-life. Circularity initiatives are structured around three main pillars: using fewer resources, using them for longer, and reusing them. However, the distribution of indicators across these three pillars is revealing: 54% of the indicators used relate to actions aimed at using less—responsible sourcing, eco-design, and operational optimisation—while 43% concern actions aimed at reuse—material recovery and residual waste management. Only 3% relate to actions aimed at using resources for longer—extending product lifespans, product-as-a-service models, and industrial ecology. As a result, three major blind spots emerge: repair and refurbishment, service-based business models, and industrial ecology—the latter is not measured by any company in the panel.
A data challenge that remains underestimated. While indicators are relatively evenly distributed across the value chain—31% upstream, 36% internal, and 33% downstream—the quality and accessibility of the data vary significantly. Internal operations remain the most controlled source of data, but the real challenge lies elsewhere: of the 33% of downstream indicators, 26% rely on waste operator data and only 7% on customer data. In other words, companies measure what they discard effectively, but have very limited visibility of what their customers actually do with their products—returns, repairs, and product lifespan—precisely the data needed to manage strategies focused on “using products for longer.”
The benchmark and regulatory analysis identified 120 distinct indicators. Given this diversity, the challenge is to select a core set of indicators that is relevant, actionable, and proportionate to the organisation’s capabilities.
The study proposes a methodology based on six selection criteria:
Managing Director | Paris, France
Stéphanie is a Managing Director based in Paris, specializing in digital transformation, project management, and change management in the energy and utilities sector. She helps organizations optimize processes, enhance CRM, and drive agile transformation initiatives.