The Cyber-Physical Inflection: When Everyday…

Most of what drives a data center’s energization date sits with utilities, regulators, and suppliers, not the builder. Sia explains the pattern behind late dates and five questions that show whether yours holds, so you can act before the slip is expensive.

If you carry the construction debt on a data center, you carry the cost of a late energization date. Rent commencement on your data center depends on it, and 57% of projects ran three months or more late in 2025 (JLL). The causes usually start outside the construction schedule, in power, permits and approvals. In Santa Clara, a $450M utility upgrade due in 2028 leaves finished data centers waiting for power. In Virginia, a 2,100 acre campus ended in July 2026 after courts voided its rezoning.
Your lease sets target delivery dates, and rent commencement waits for delivery, which depends on power and commissioning. When the date slips, the developer pays. In one developer’s public filing, tenants earn a rent credit of one day of base rent per day of delay, and two days per day after the first 90. Another developer discloses that its customer can terminate affected leases without a fee if delivery requirements are missed. Your lender tests the same date: Moody’s (31 July 2026) writes that delays may compress the margin between projected DSCR and covenant thresholds. Which of these applies to you depends on your lease.
Pipelines, transmission lines, ports and data centers look different, but each is a large infrastructure project whose date depends on permit issuers, utilities and suppliers as much as on the builder. In our experience they run into the same ten challenges. Most are set by parties outside the build. You hire the best specialist for each scope, and the main contractor runs the build schedule. Each specialist’s schedule stops where their scope stops, and no one’s job is to reconcile them, so the clashes surface late. Every project is a one-off: a new site, a new regulator, often contractors working together for the first time, so the links get rebuilt each time. You cannot change how a utility or regulator behaves, but you can map what to expect before you build.
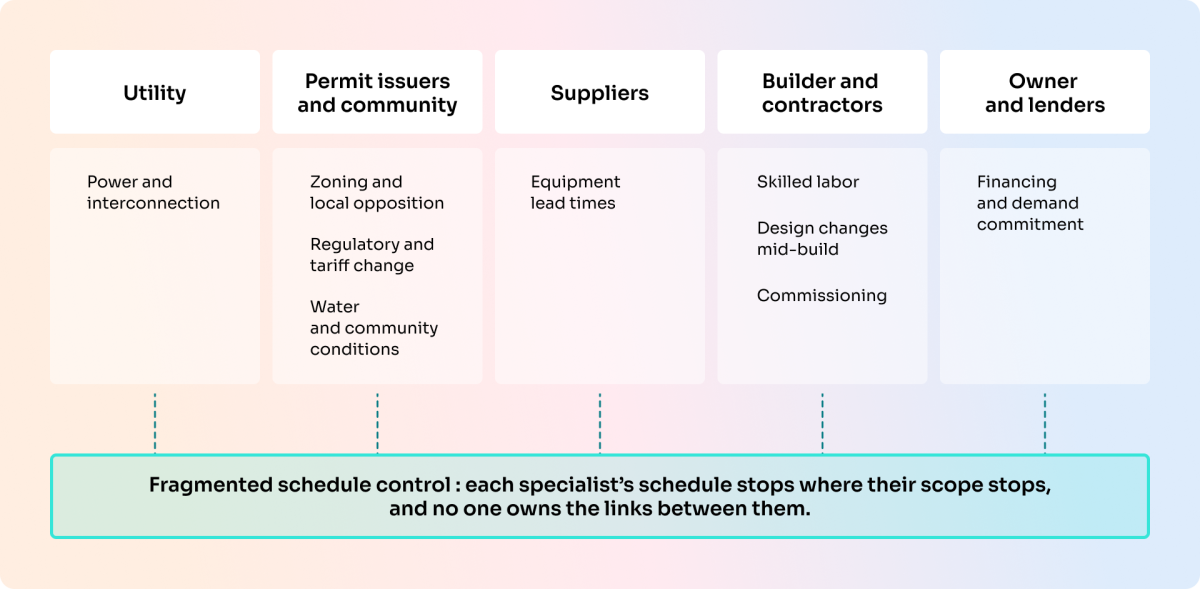
Sia worked on the Trans Mountain Expansion for five years. Every segment had engineers, project controls and a contractor, each doing its job. The gap between their schedules was the same one, and the links between permit and construction dates belonged to no one. Three of the ten challenges hit a pipeline and a data center the same way.
Power. Every pump station and facility needed it. We supported the relocation of more than 300 power poles, the permitting of multiple substations and grid improvements, and coordination with local utilities at the valve sites. The new line alone added about 137 valves. A data center needs a utility allocation, a substation and an interconnection study.
Approvals. More than a dozen federal, B.C. and Alberta agencies ran their own permit processes. B.C. alone required about 1,200 provincial permits, and our tracker followed 57,000 permits and agreements across the program. A data center also needs approvals from several issuers, such as zoning, environmental and the utility.
Equipment. Specialized drilling equipment had to be booked well ahead, so a late start anywhere could leave it unavailable for months and cascade through the schedule. On a data center, generator step-up transformers passed 160 weeks of lead time in early 2026 (Wood Mackenzie via Reuters).
Putting an integrated view in place changed the outcome. On Mount Robson, the first B.C. segment, we built one tracker of permits and inputs on a map, and used it to prioritize work, coordinate with vendors and ministries, and work with the construction teams to change what they could to minimize impact on their schedules. The segment started on time. One section that mobilized before its permits lost a season of construction, about $71M. On a data center, the same mechanisms give us a rule of thumb for what a slip costs.
That is about $20M per $1B. About half is capital carrying cost: by the time a slip is clear, most of the capital has been spent, and we assume a cost of capital near 6%, about where construction loans price today (Altus Group, Q2 2026). The rest is your owner’s team, price escalation on the remainder still to spend, and crews held on site. Rework, rebooked equipment, extra crews to recover the schedule, extra materials, third-party penalties, tenant termination rights, site carry and remobilization, a lost construction season, carry on IT equipment, and lease damages come on top. It is a rule of thumb, so swap in your own spend base and cost of capital.
We think about finishing the build in five stages, each with a key question that tells you where to focus your efforts. Clear each one only with evidence.
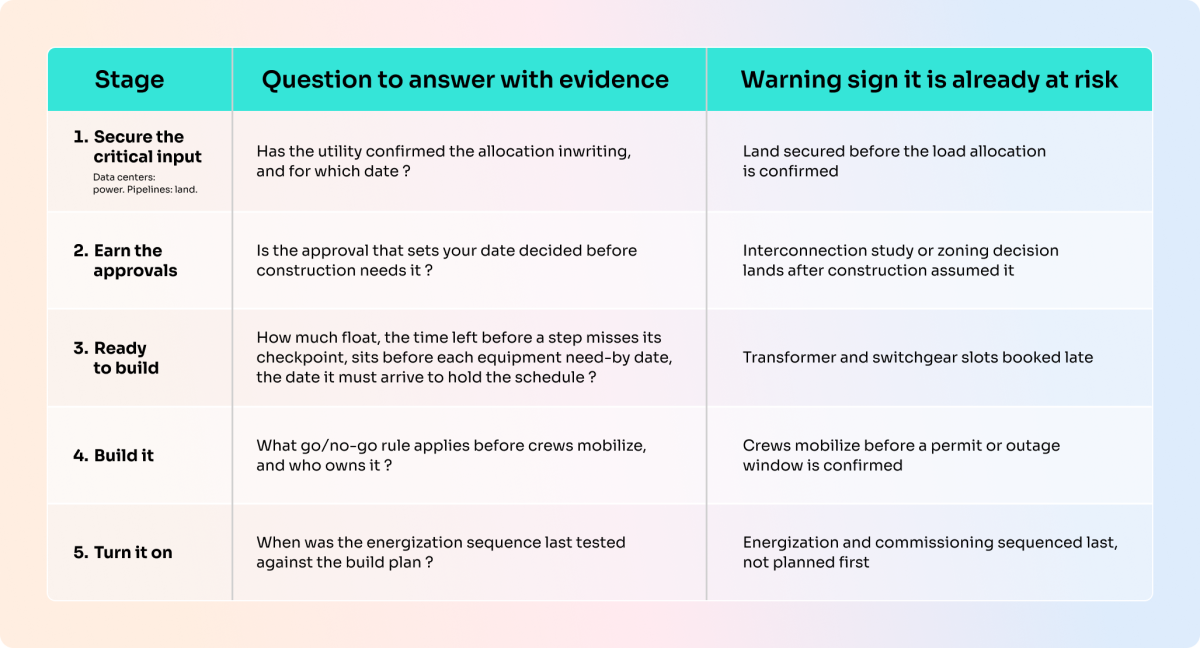
Your specialists keep their scope, as on Trans Mountain. Sia ties their plans into one schedule and runs the weekly review, and you own every go or no-go decision. Every input is a dated utility, permit or equipment commitment with a source and a named owner, so the result is an evidence-backed date: your starting point with your tenant, lender, regulator or board. Week 2 gives you the critical path, the chain of steps that sets your date, and week 6 a date per site. The weekly review runs in the Command Center, a Sia-hosted tracker that shows on one map the dependencies and critical path across all specialties. It is backed by a repository of regulatory and industry benchmarks, built out for each market, on how utilities, regulators and suppliers behave: permit and interconnection timelines, equipment lead times and what communities expect. Your dates are tested against it. After week 6 the Command Center keeps you on track.
Tell us your build and target energization date, and we will show where the date is exposed.
Managing Partner | Calgary
Sohail is the Managing Partner of the Calgary and Vancouver offices of Sia Partners. Sohail has a MBA (International Business), is a Project Management Professional (PMP), and a Certified Management Consultant (CMC).

JLL; DCD (11 Nov 2025); Converge Digest (4 Jul 2026); SB Energy S-1/A No. 2 (21 Sep 2026); Applied Digital 8-K (2 Jun 2025); Moody’s (31 Jul 2026); Wood Mackenzie via Reuters (9 Jul 2026); Altus Group (20 Aug 2026); Trans Mountain (permitting page, valve locations page); B.C. government (29 May 2018). The rule of thumb is rounded from Sia’s delay-cost model. Other Trans Mountain figures are Sia’s account of its work.